

This presentation reviews the changes in the number and composition of the Dutch civil service in the period 2002-2015 in 10 sections, 4,000 words, and 18 figures. You can get the entire presentation in a pdf format here. A version in Dutch is here. To navigate the presentation, use the menu on the right or click on the title of each section below:
The Netherlands prides itself on a strong, professional, and effective civil service. But over the last decade the Dutch civil service has been facing significant challenges related to its size, efficiency, and diversity. In response to these challenges, the civil service has been a subject of continuous political discussion and proposals for reform.In this presentation, I look at the effects of these discussions and reforms. Has the Dutch civil service been radically transformed over the past 14 years? Has the number of civil servants declined substantially? What are the important trends beyond the overall change in size? How has the composition of the civil service in terms of gender, rank, and age changed, if at all?
The first question to consider is whether and how much has the size of the civil service changed. In the graph below, as in all that follow, we consider not the raw number of actual civil servants, but the so-called full time equivalents, or FTE. The numbers pertain to all civil servants (in FTE) at the central level of the Dutch public administration.
Figure 1 shows the changes in the total number of civil servants between 2002 and 2015 (left panel). Starting from a total of 118,057 FTE in 2002, the number of civil servants declined to 109,150 in 2015. The modest decrease amounts to a contraction of 7.54%. The lowest number was actually achieved in 2005 when 108,431 civil servants worked at the central administration. Afterwards, there was a gradual increase to a peak of 115,295 people in 2009, and subsequently the numbers started to gradually decline again until 2012, when they stabilized around 110,000.
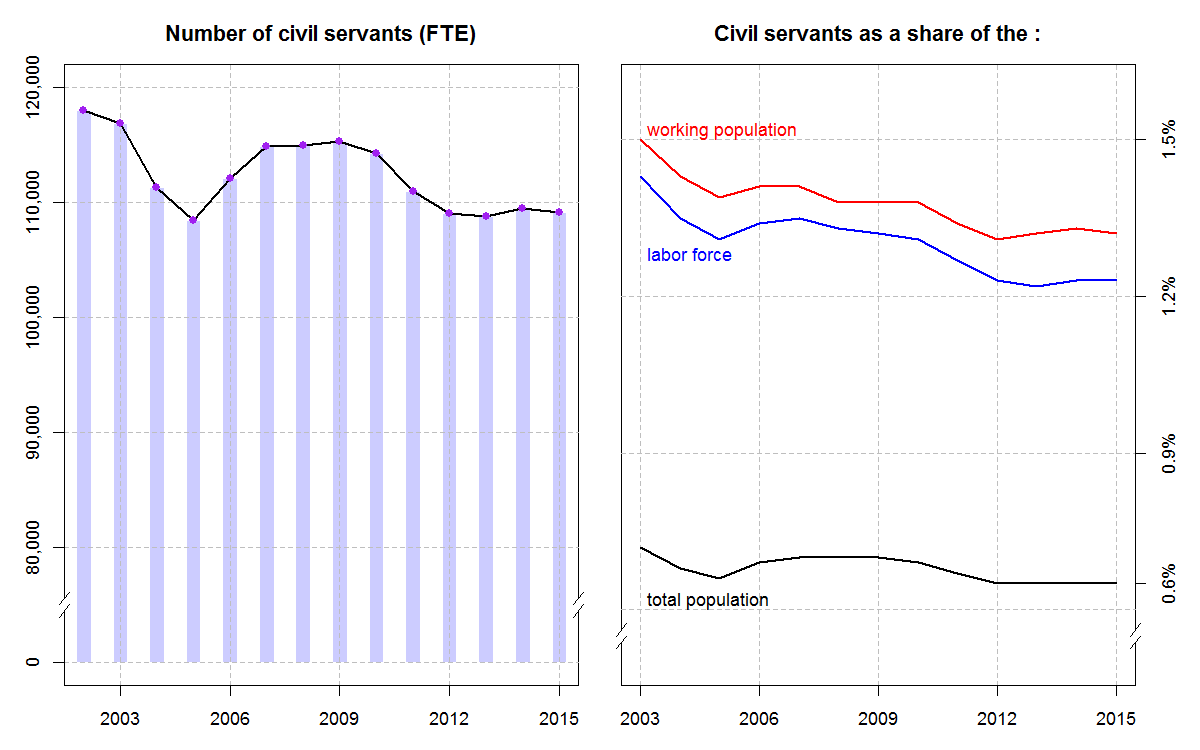
The changes in the total numbers presented in isolation can be misleading if the broader societal and economic context in the country is not taken into account. Responding to this issue, the right panel of Figure 1 presents the number of civil servants as a share of different subsets of the Dutch population. The share of the civil service from the total population is, in fact, rather small – 0.65% in 2015, and has declined slightly from 2003, when it was 0.72%. The drop has been similarly small when we consider the share of the civil service from the labor force (from 1.43% in 2003 to 1.23% in 2015) and from the working population (from 1.5% in 2003 to 1.3% in 2015).
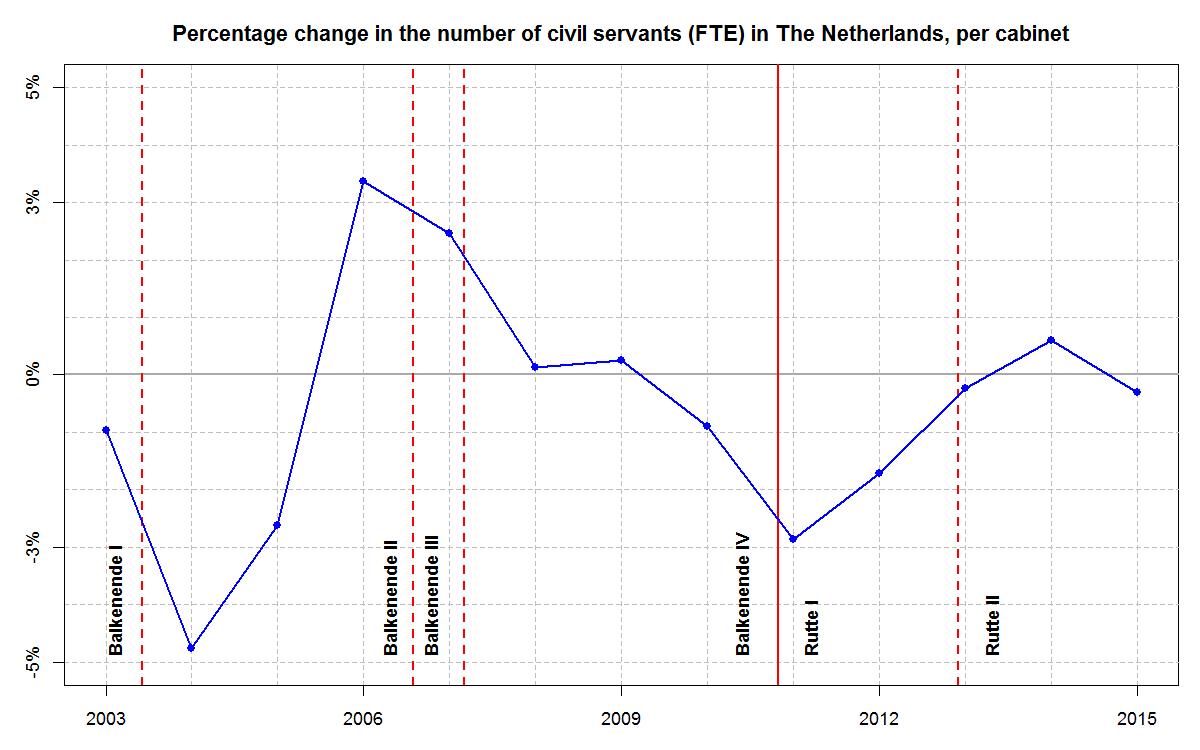
Focusing on the percentage change from the previous year, Figure 2 shows how the direction and scale of changes in the number of civil servants fluctuated over time. The figure also marks the years in which the Dutch governments (cabinets) changed. The four cabinets led by Balkenende (I, II, III, and IV) seem to have mixed records when it comes to the reduction of the size of the civil service. The first cabinet of Rutte is consistently associated with reductions, while during the second one only very minor changes have occurred.
The changes in the size of the civil service as a whole, or the lack thereof, can hide important transformations within its ranks. The Dutch civil service comprises of an orderly hierarchy of seventeen main 'ranks' ('schaals') that are associated with different positions and responsibilities within the organization and signify seniority and status.
Figure 3 shows how the number of civil servants changed between 2002 and 2015 per each rank within the system. The blue bars show the distribution in 2002, and the red bars show the distribution in 2015. The bars are semi-transparent and are plotted on top of each other. When the red bar is longer than the blue one, there have been more civil servants at that rank in 2015 than in 2002, and vice versa. To the right of each bar, the actual change in the numbers between 2015 and 2002 is recorded for the respective rank. (Higher ranks imply higher seniority, payroll, and status within the organizational hierarchy.)
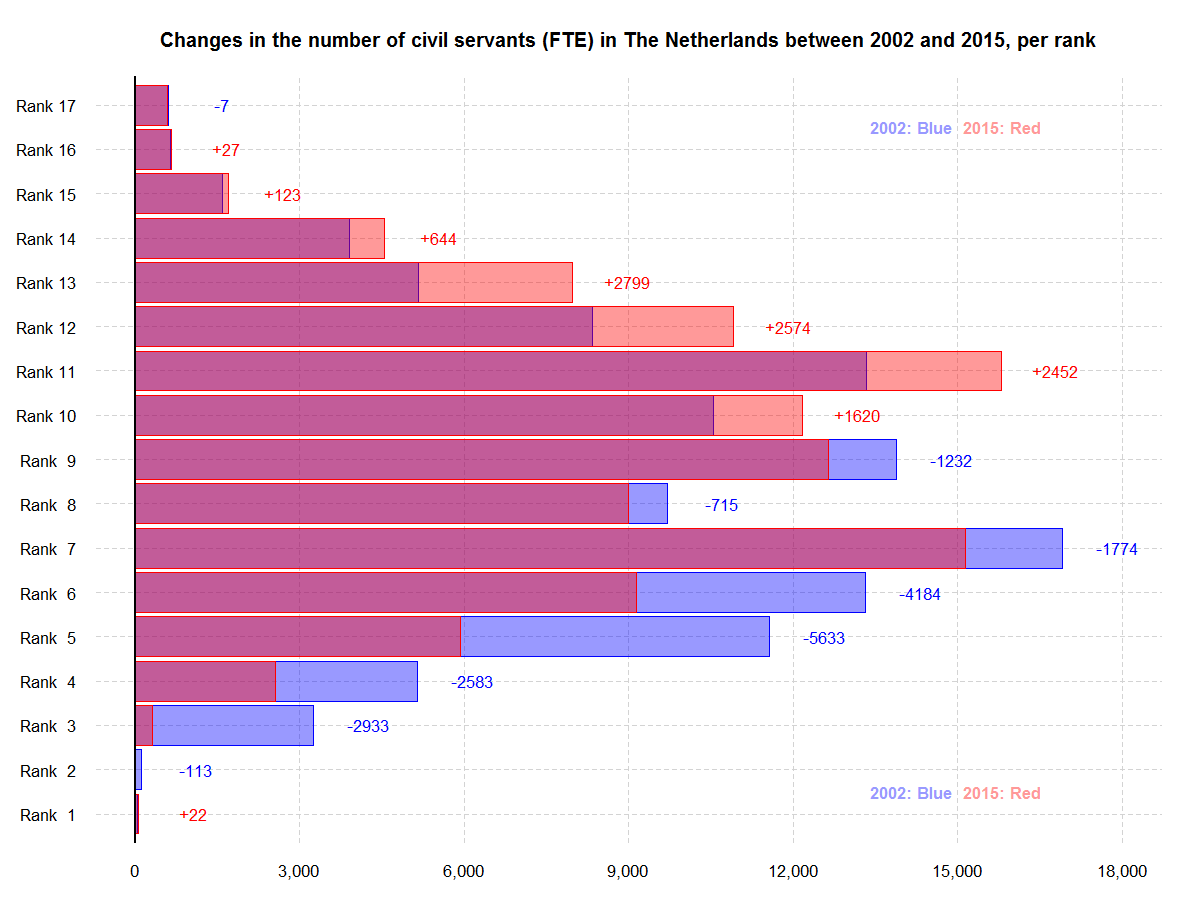
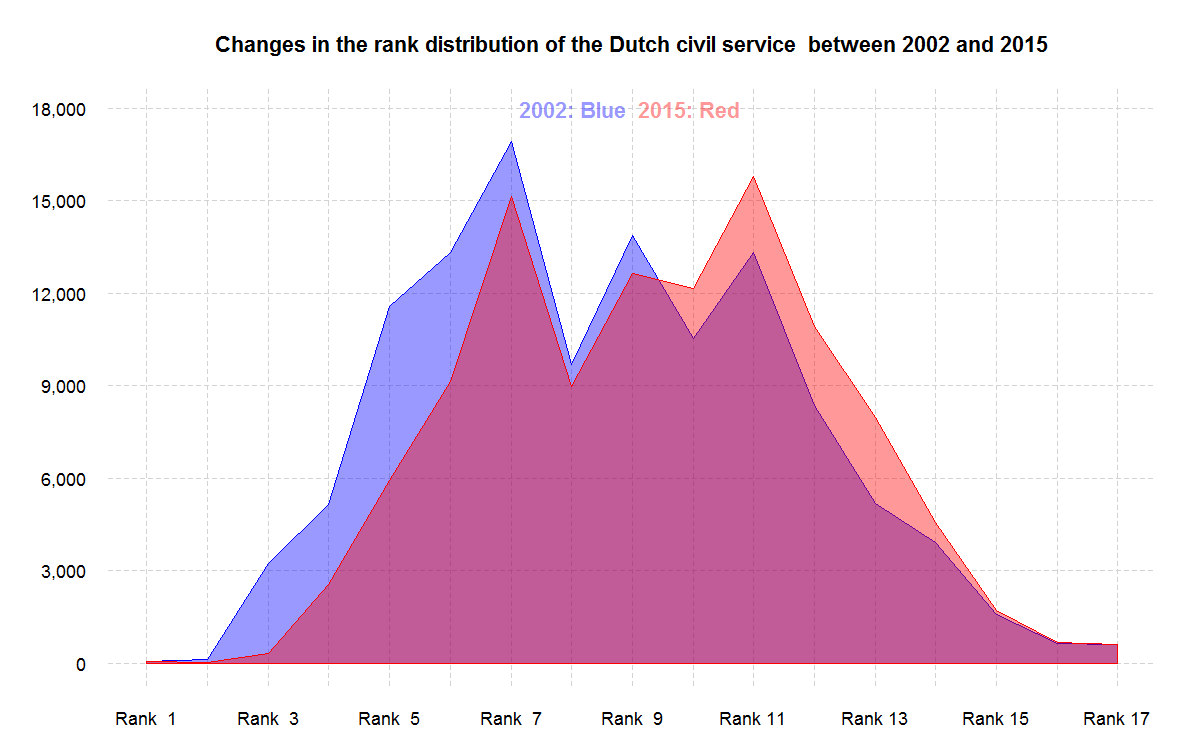
The figure shows that for each of the ranks 10 and above, there are in fact more civil servants in 2015 than in 2002. At the same time, in the lower ranks (9 and below), there are significant decreases, both in absolute numbers and percentage terms, between 2002 and 2015. The overall small reduction in the total size of the civil service since 2002 has been produced by a combination of a rather big increase in the number (and share) of civil servants working in the upper ranks and an even bigger decrease in the number working at the lower ranks. This is even easier to see from Figure 4, which presents the same data, but flips the horizontal and the vertical axes to focus on the shape of the rank distributions in 2002 and 2015. There is a clear shift in the overall seniority of the system to the right (more senior, higher ranks), with the exception of the very high ranks (15, 16, and 17+), which exhibit relatively smaller increases in the period. It is also significant that the modal rank has shifted from rank 7 to rank 12.
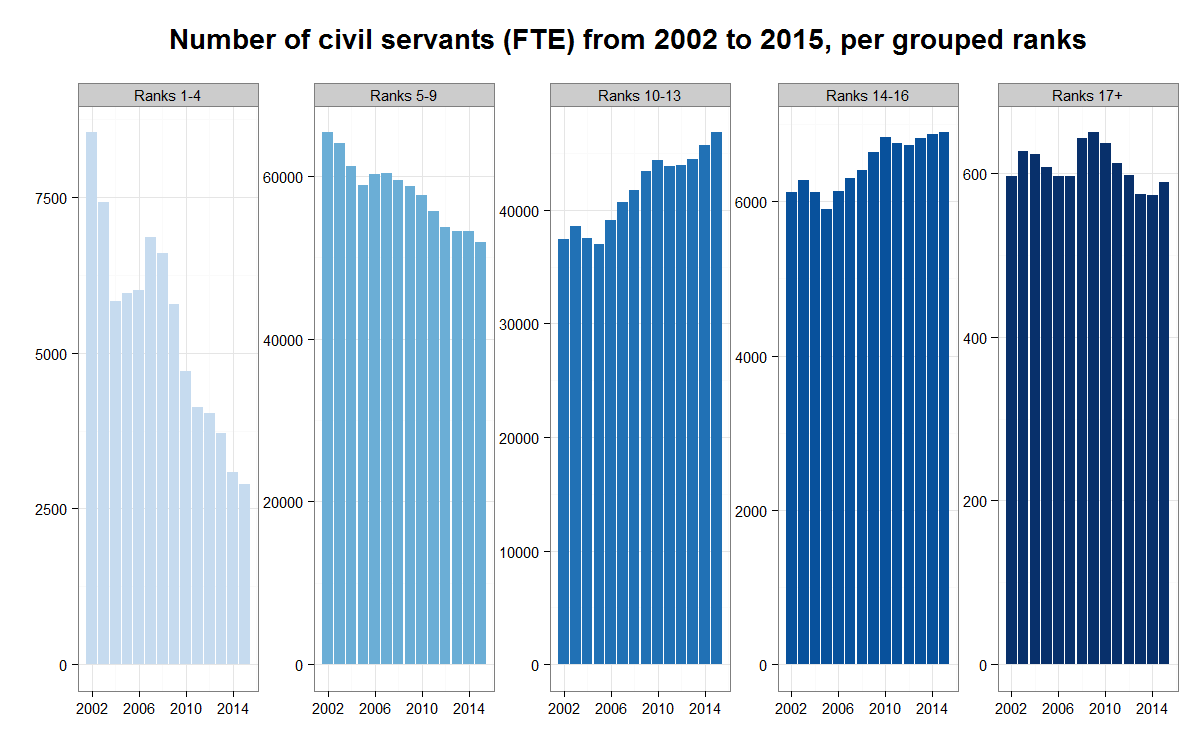
To zoom in at the patterns of change in the rank distributions, Figure 5 traces the changes over each year between 2002 and 2015 for five groups of ranks (1 to 4, 5 to 9, 10 to 13, 14 to 16, and 17 and above). Note that the y-axis in the graph is different for each group of ranks because the total numbers in each group differ quite a bit. The figure clearly shows the steep and steady decline in the two lowest groups of ranks, the similarly steady rise in the group of ranks 10 to 13, the stagnation in the growth of ranks 14 to 16 after 2010, and the variable path, without clear trend, of ranks 17 and above (which however are very small in absolute numbers).
Different ranks come with different salaries, so it is interesting to ask whether the salary costs for the civil service have increased in the period 2002-2015 due to the rising seniority of the remaining ones and despite the total modest decrease in the number of civil servants employed. If we do a very rough calculation in which we multiply the number of civil servants at each rank with the salary for that rank, we find that in 2015 the annual salaries would have taken €16.7 million more than in 2002. (This number if probably an underestimate, because it does not take into account bonuses and other additional financial rewards, which likely depend on seniority. The salaries for all ranks have been calculated at step 6 of the payscale).
Civil servants are bound by a common statute, but they also work for individual ministries and other organizations. Therefore, it is important to trace how the distribution of civil servants changes across the different organizations of the central public administration. Figure 6 shows a 'waffle' plot of the distribution. Each square represents approximately 1%, or 1090 civil servants (FTE). There are 10 rows and 10 squares per row. The biggest share goes to the Ministry of Security and Justice, which in 2015 accounts for approximately one-third (32%) of all civil servants at the central level in the country. The Ministry of Finance follows with 28%.Together, the biggest two ministries account for six out of every ten civil servants. The organizations next in line are quite smaller.The Ministry of Environment has 11%, the Ministry of Economic Affairs 8%, the Ministry of Internal Affairs has 7%, Education and Health each have slightly more than 3.5%, External Affairs and Social Affairs each have slightly more than 2%. The smallest units are the collection of other state organswith 1.2% and the Ministry of General Affairs with less than 1%.
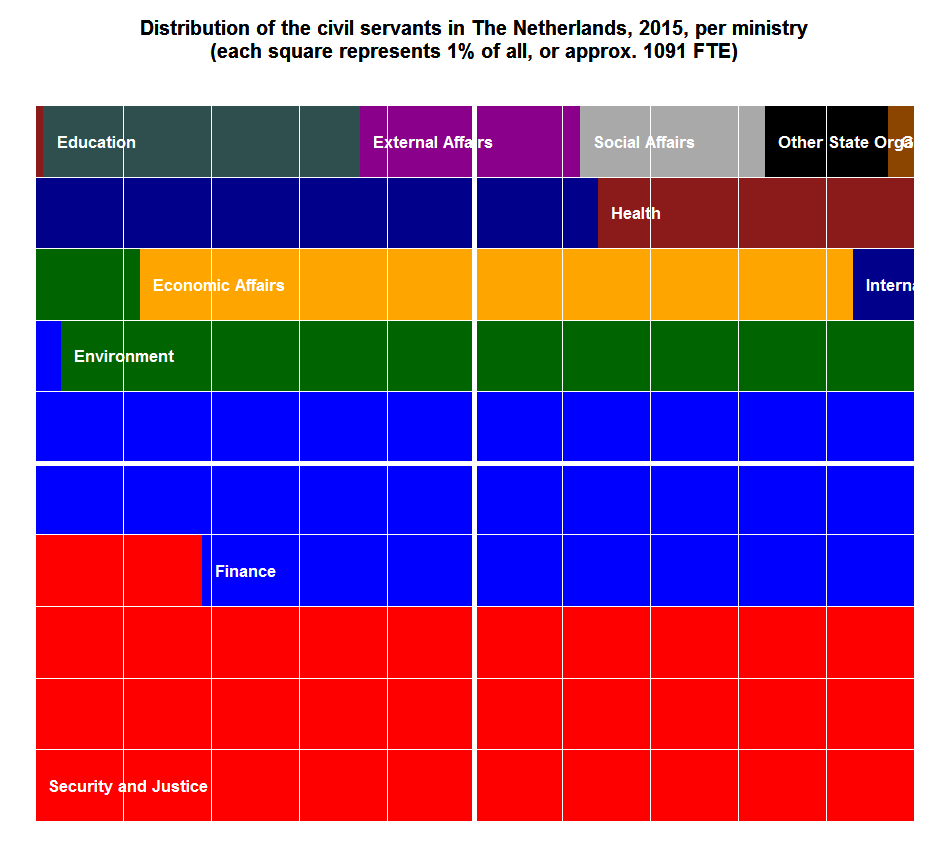
Figure 7 shows the changes in the numbers of civil servants (FTE) between 2002 and 2015 for each ministry. As in the previous graphs, the numbers for 2002 are in blue and for 2015 in red. The color of the protruding bar (blue or red) indicates whether there was net decrease or increase during the period. In fact, only the Ministry of Internal Affairs experienced a significant increase in the period (and to a smaller extent the Ministry of Education). Environment and Economic Affairs exhibit the biggest decreases.
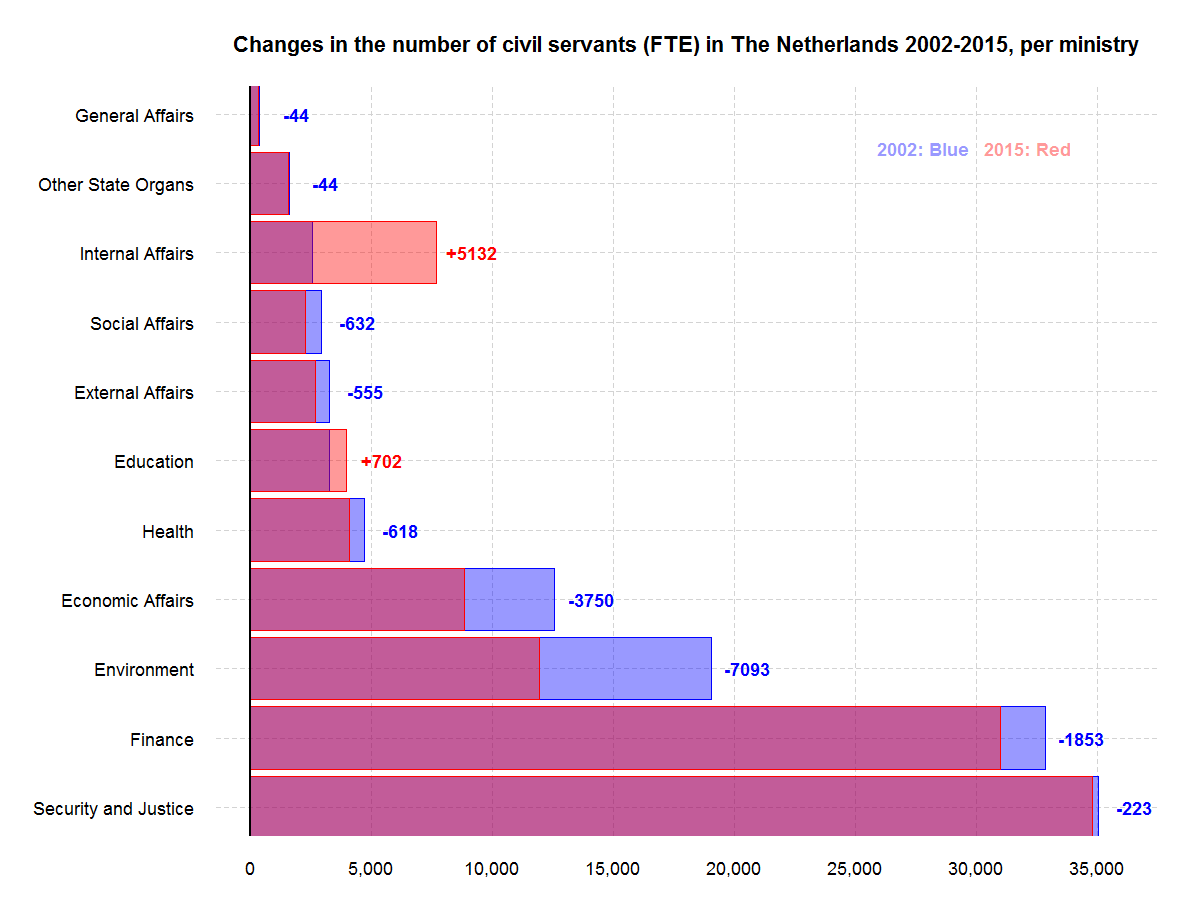
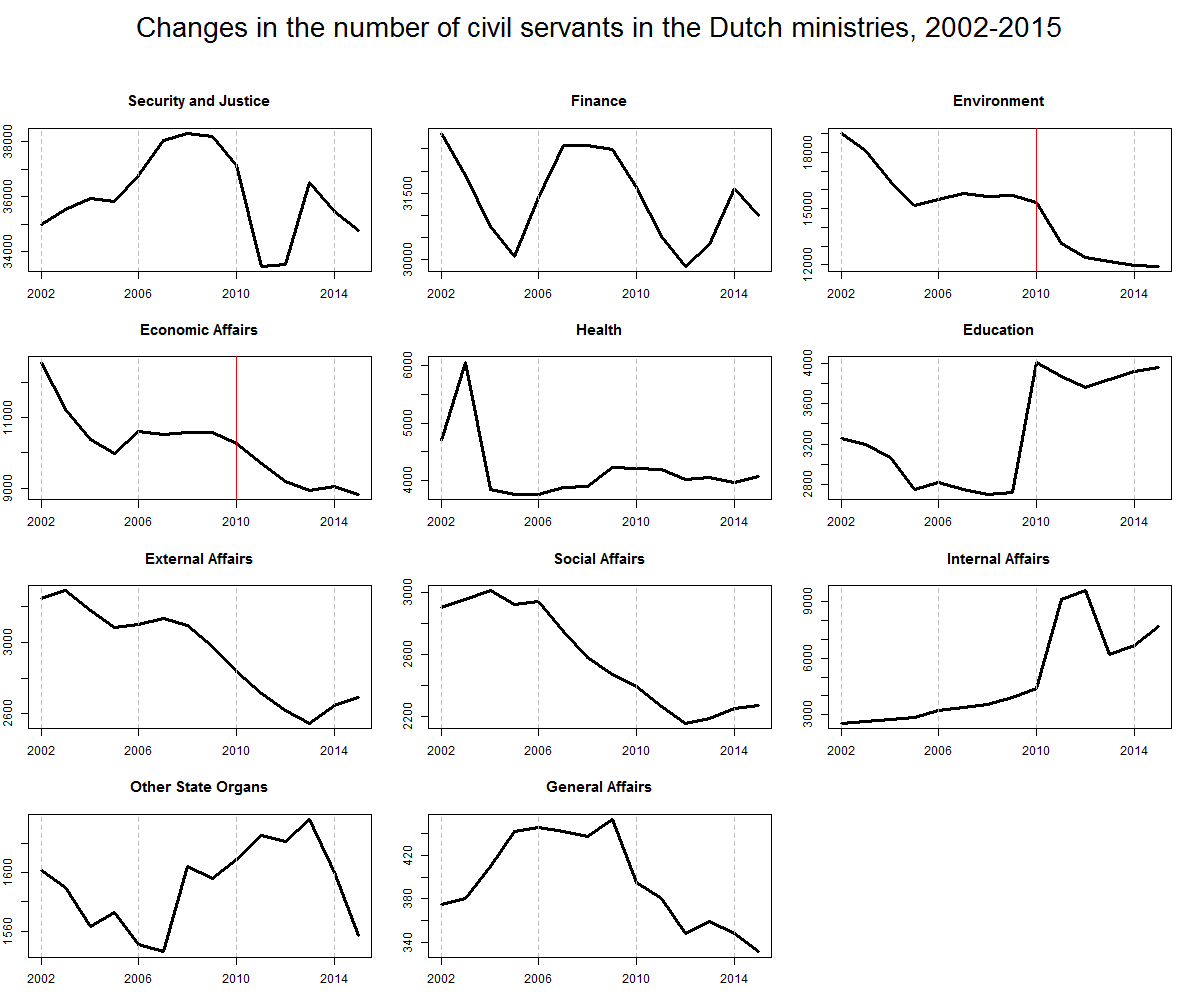
Figure 8 traces the changes in the number of civil servants in the ministries for each year between 2002 and 2015, and shows that the patterns of reductions and increases have been quite varies across the organizations. The ministries are ordered by the size of their civil service in 2002. The red lines for Environment and Economic Affairs in 2010 signify when significant organizational transformations occurred: for the former this is the merger with Transport; for the latter it is the merger with Agriculture (the numbers before 2010 include these now-defunct ministries under the headings of their successors).
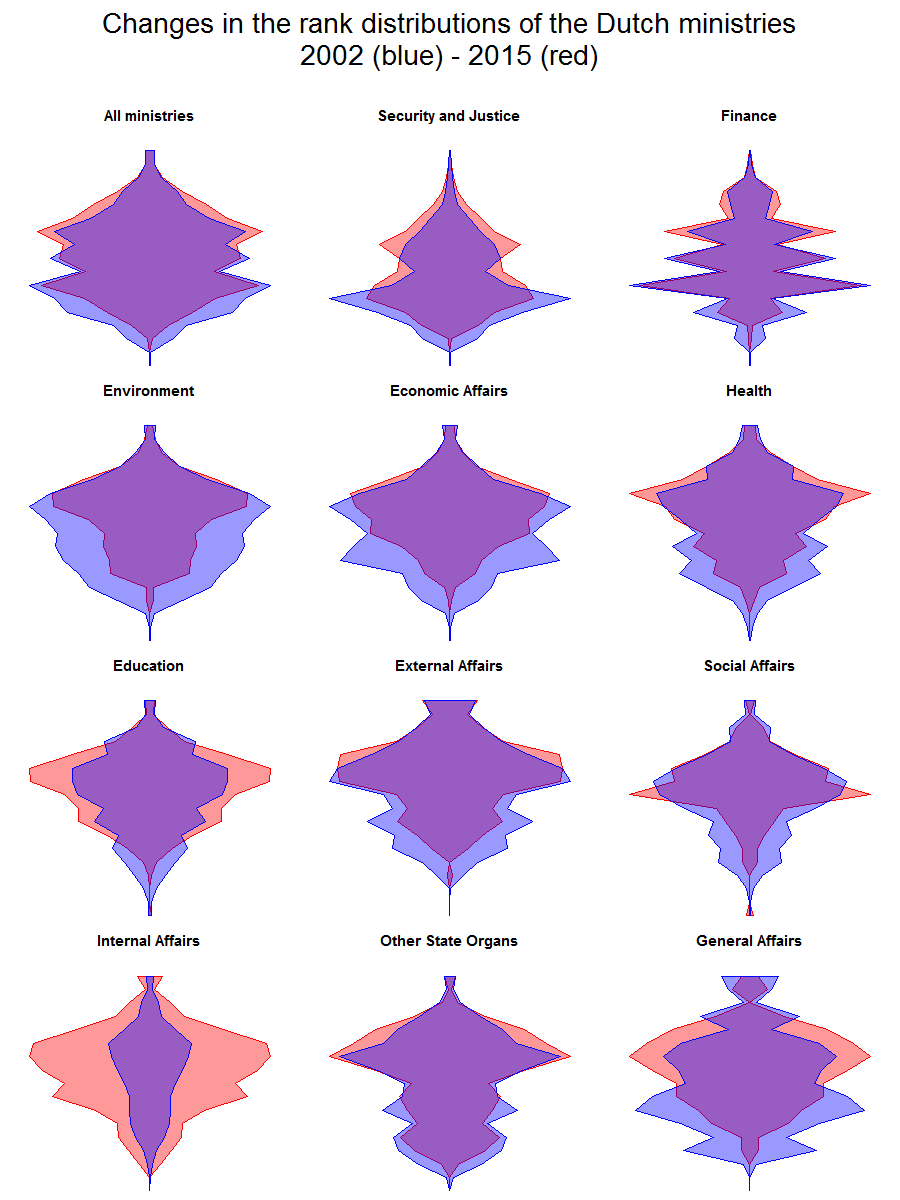
We can also look at how the distribution of ranks within each ministry changed over time. Figure 9 shows how the relative distribution of the ranks within each ministry changed between 2002 and 2015. The ministries are ordered according to the size of their civil service in 2002 (top to bottom and left to right). The figure allows comparisons of the seniority structure between ministries, but also within ministries over time. The seniority of the distribution increased most dramatically in the case of Internal Affairs, General Affairs, Education, and some others. In Environment and Economic Affairs, which experienced the biggest overall reductions, we can see that only the lower ranks have been reduced, while the higher ones remain at similar levels in 2015 as in 2002.
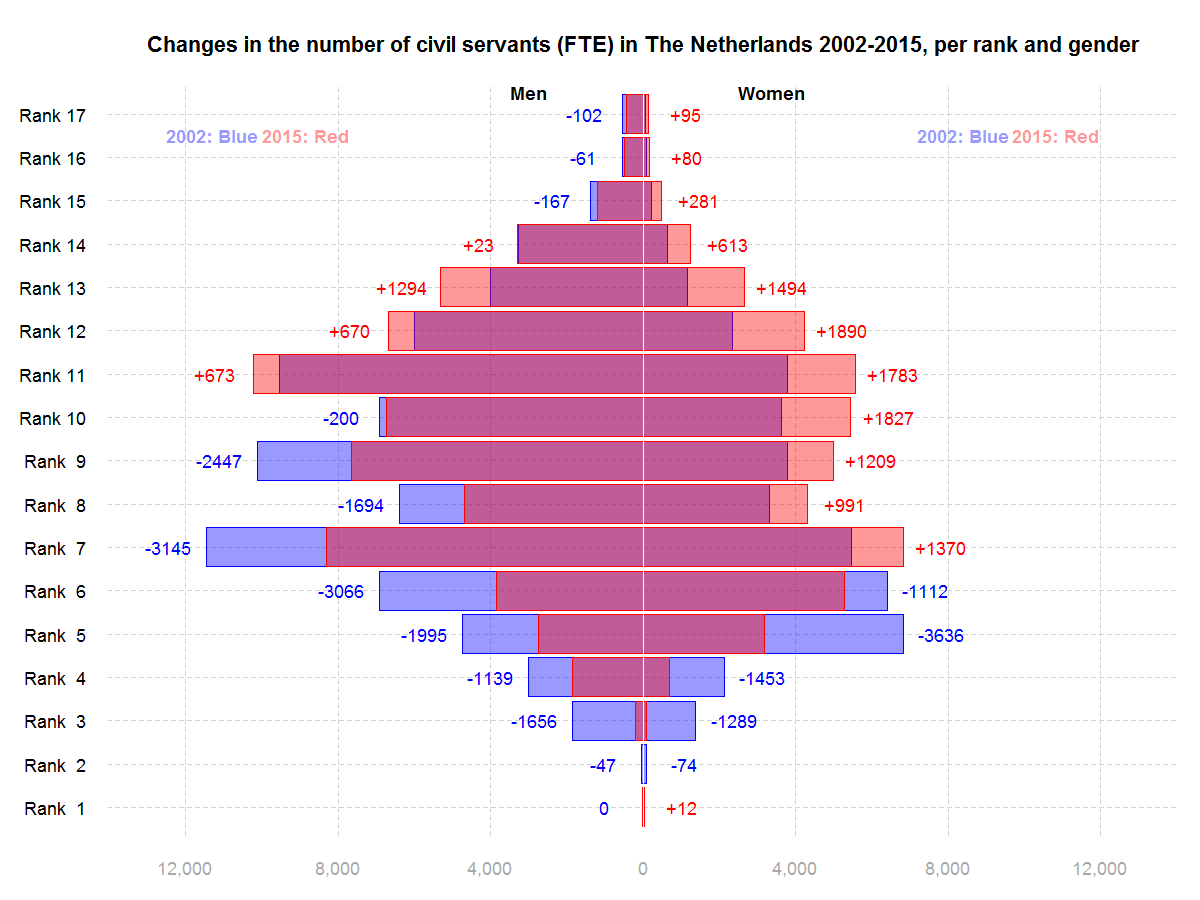
An important challenge and a lasting concern of the Dutch public administration has been the unequal gender balance. Overall, women represented less than 36% of the civil servants in 2002. The situation has improved somewhat:in 2015 the gender distribution has become more balanced, but it is still unequal (42% women). Figure 10 shows the changes in the number of civil servants between 2002 and 2015 for each rank, and then separately for men (left part of the figure) and women (right part of the figure). As with the previous graphs, the 2002 bars are in blue and the 2015 one are in red, and the two sets of bars are plotted on top of each other. If the red bar is protruding, it means that for that gender and rank, there was a net increase in the number of civil servants (FTE) since 2002, and if the blue one is protruding, it means that there was a net decrease. Next to each bar the exact number representing the reduction or increase is plotted (in red for increase and blue for decrease). The figure clearly shows that for all the low ranks between 1 and 10, there has been a net decrease for men (also for the highest ranks 15 to 17). For women, the decrease is limited to ranks 2 to 6: for all others, there is a net increase between 2015 and 2002.But this does not mean that the gender balance problem has been solved.
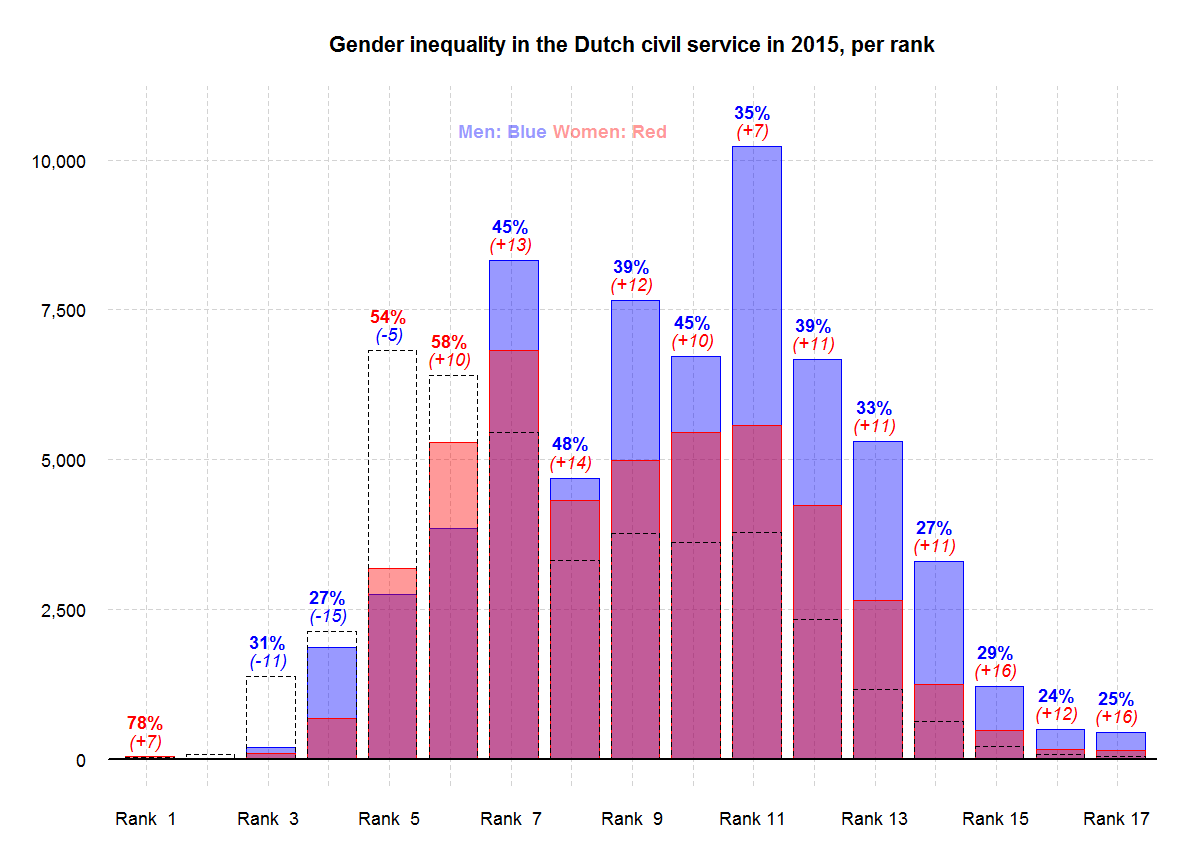
As Figure 11, which focuses on the situation in 2015, shows, for all ranks other than 1, 5, and 6, there are still more men than women in the Dutch civil service. The figure plots the number of women in red and the number of men in blue (the transparent dotted bars indicate the number of women in 2002) for that rank (plotted on top of each other). The numbers above each bar indicate the actual percentage of women in that rank in 2015, and the change (in percentage points) since 2002. For all ranks with the exception of 1,3, and 6, the gender balance has improved. But still, only in ranks 1, 5, and 6 the number of women exceed the number of men.
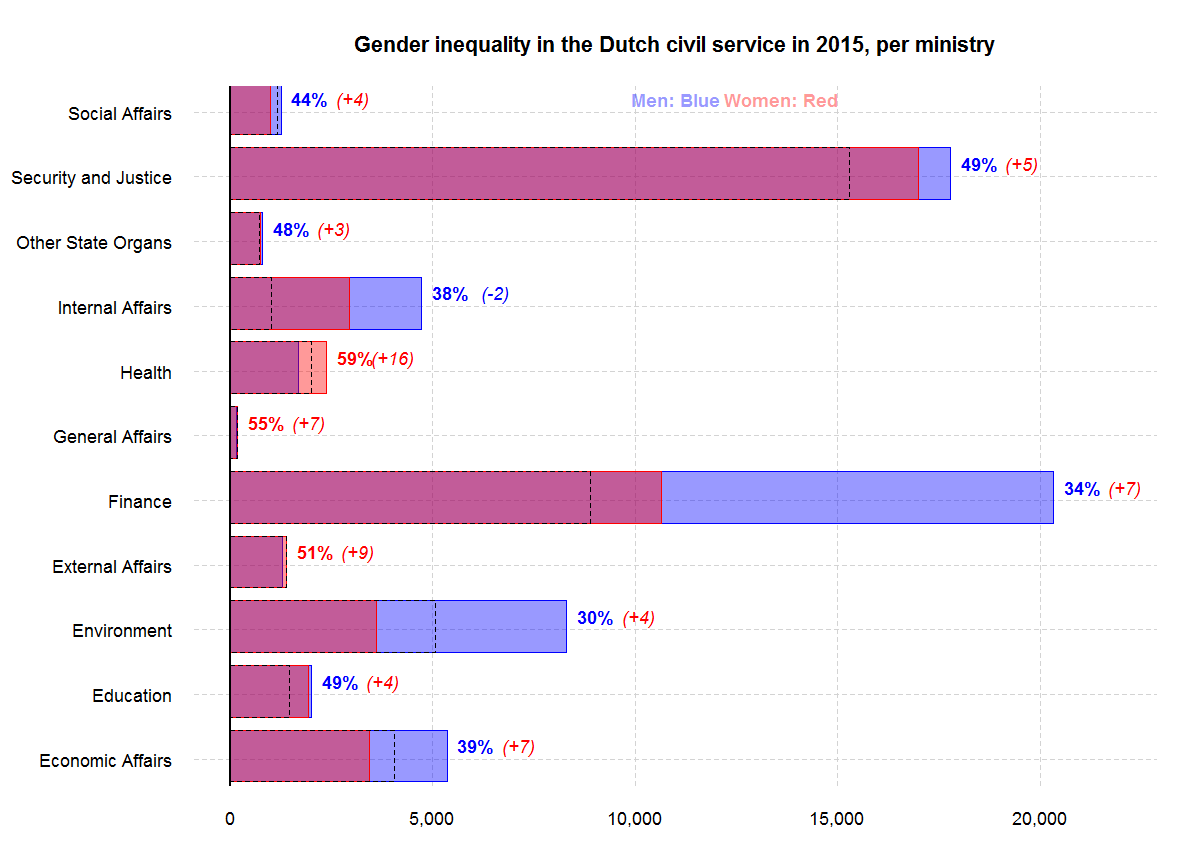
The situation varies quite a bit when we look at individual ministries (Figure 12).Health and External Affairs actually have more women civil servants than men. General Affairs, Education, Security and Justice and the Other State Organs are very close to gender parity. The gender distribution in Social Affairs is not too biased neither. But in the (very big) Finance ministry only 34% of the civil servants are women, and women are less than 40% in Economic Affairs, Internal Affairs, and the Environment, which has the worst balance with 30% women. In should be noted that between 2002 and 2015 the gender balance has improved in all ministries with the notable exception of External Affairs.
The dotted lines show where the numbers of women were in 2002. Note that the dotted line can be to the right of the red bar even if there was a net increase in the percentage of women at a ministry (e.g. Economic Affairs, Environment, and Social Affairs), because of changes in the total number of civil servants working at the ministry (so the percentage of women could have improved even if their total number has declined).
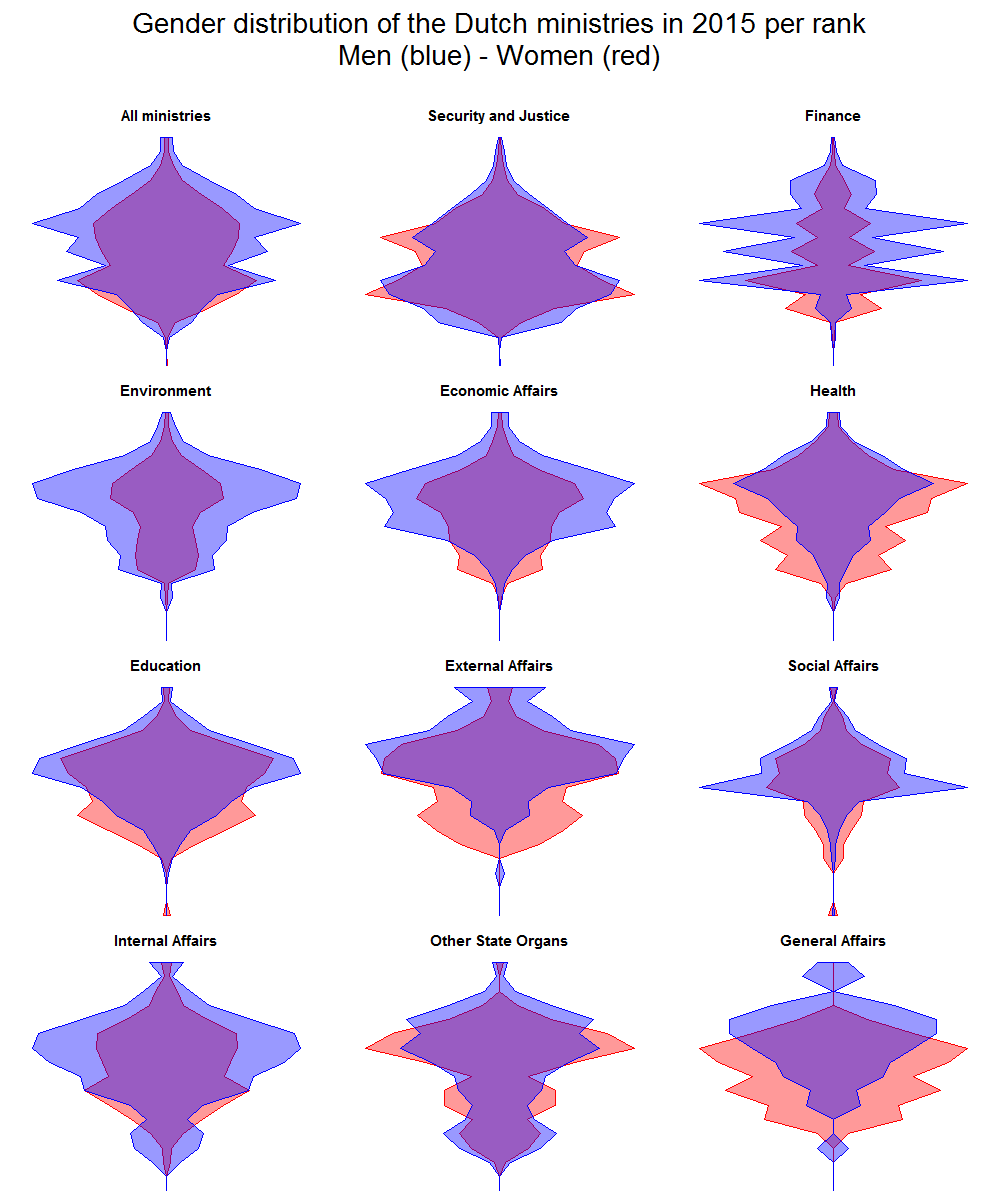
The ministries also differ significantly in the distribution of the genders across their different ranks, as Figure 13 shows (the number of men per rank and ministry is plotted in blue and the number of women in red). Irrespective of the differences, however, in all ministries the higher ranks are dominated by men, even for the ministries which have altogether a gender-balanced distribution of their civil service. In some of the ministries, the lower ranks are dominated by women (Health, Education, External Affairs, General Affairs).
Another important factor characterizing the composition of the civil service is the age distribution.This factor receives less attention than gender or seniority but can be similarly consequential. Figure 14 shows how the age distribution changed between 2002 and 2015, separately for men and women. The transformation of the age structure during this period has been quite fundamental. For men, there is a decline in the number of civil servants for all age categories up to 55 years of age. At the same time, there is a big increase in the 50-55 years category and an even more spectacular increase of more than 8,000 FTE in the 60 to 65 category. The patterns is somewhat similar for women, but both the increase and decrease per category are less dramatic, and all categories above 40 experience growth (and below 40 shrink).
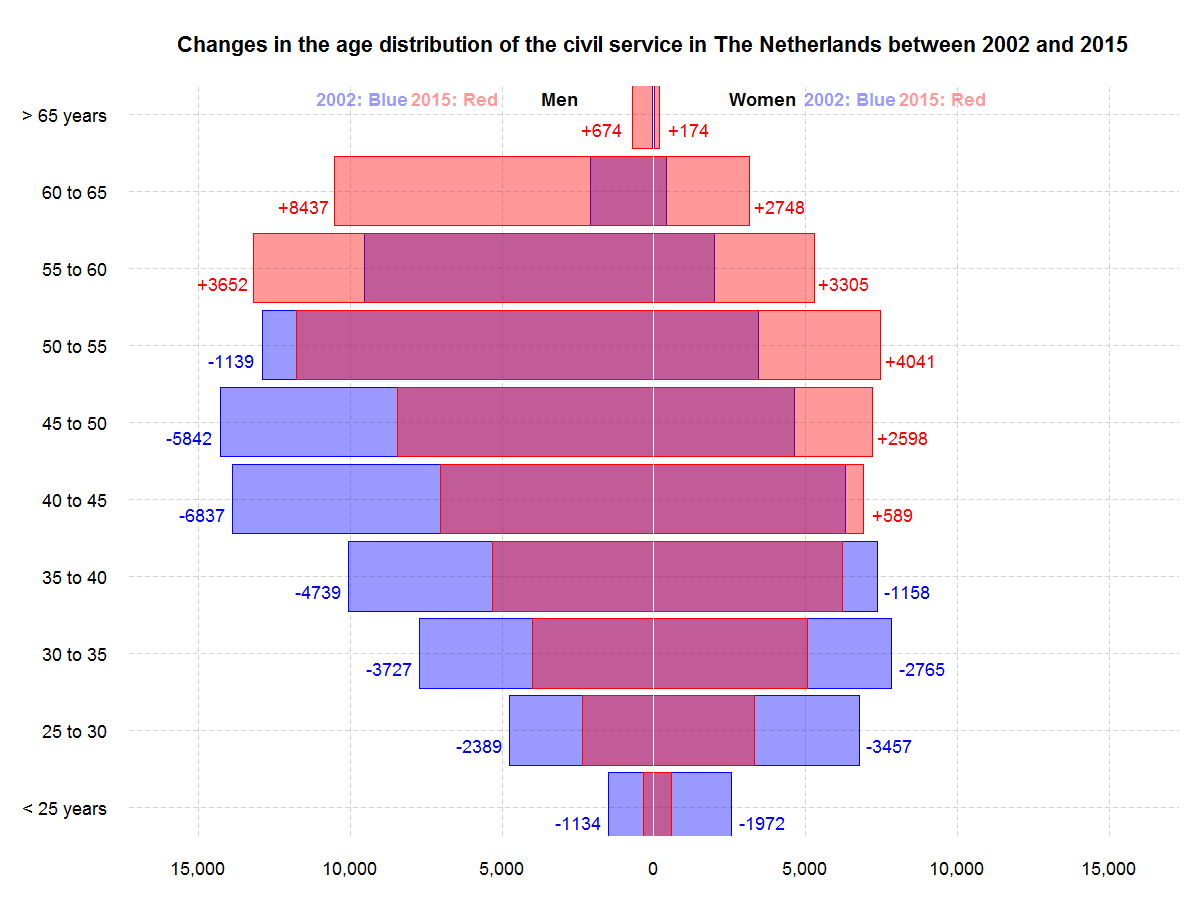
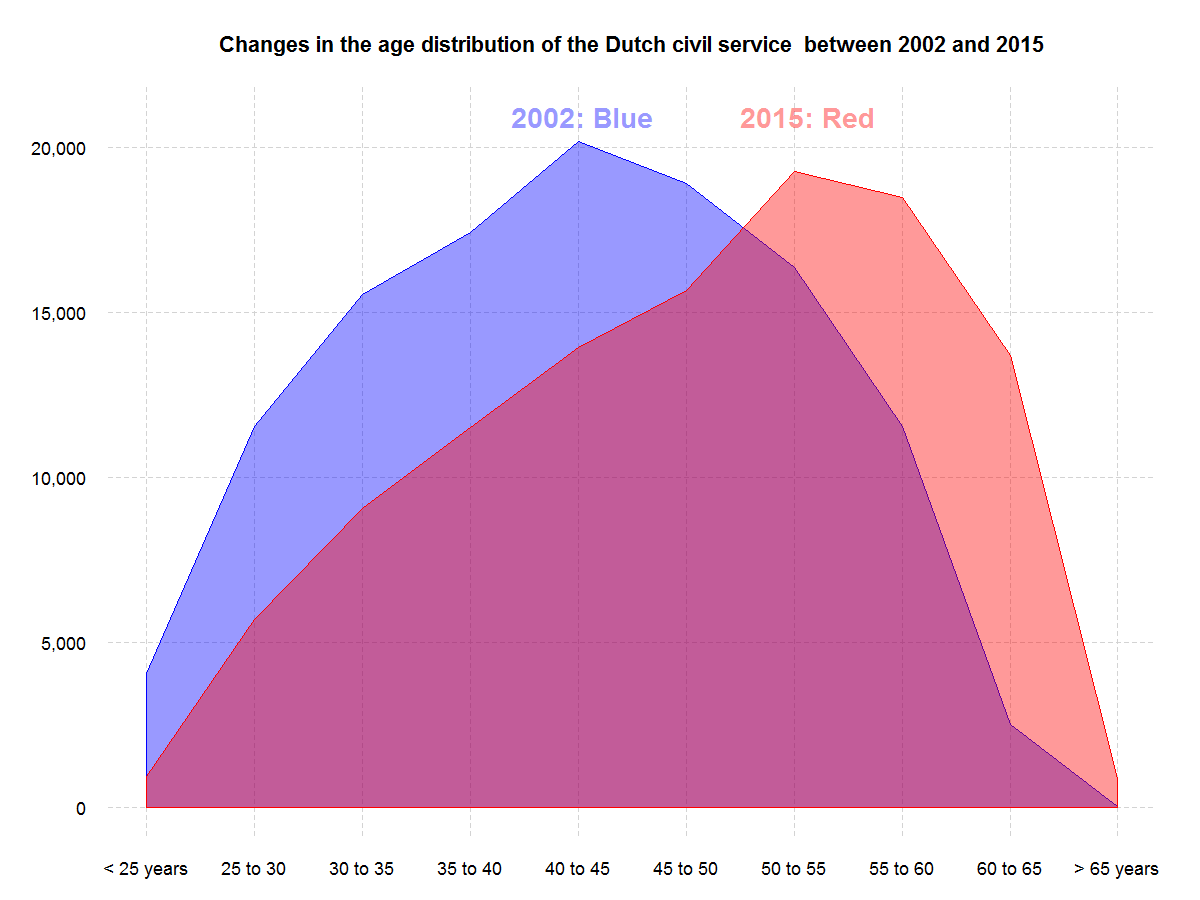
In fact, when we look at the change in the age distribution of the civil service overall, there is clear and quite dramatic aging of the population structure. The modal category has shifted from '40 to 45' to '50 to 55' and the share of all groups below 50 has declined at the expense of all groups above 50.
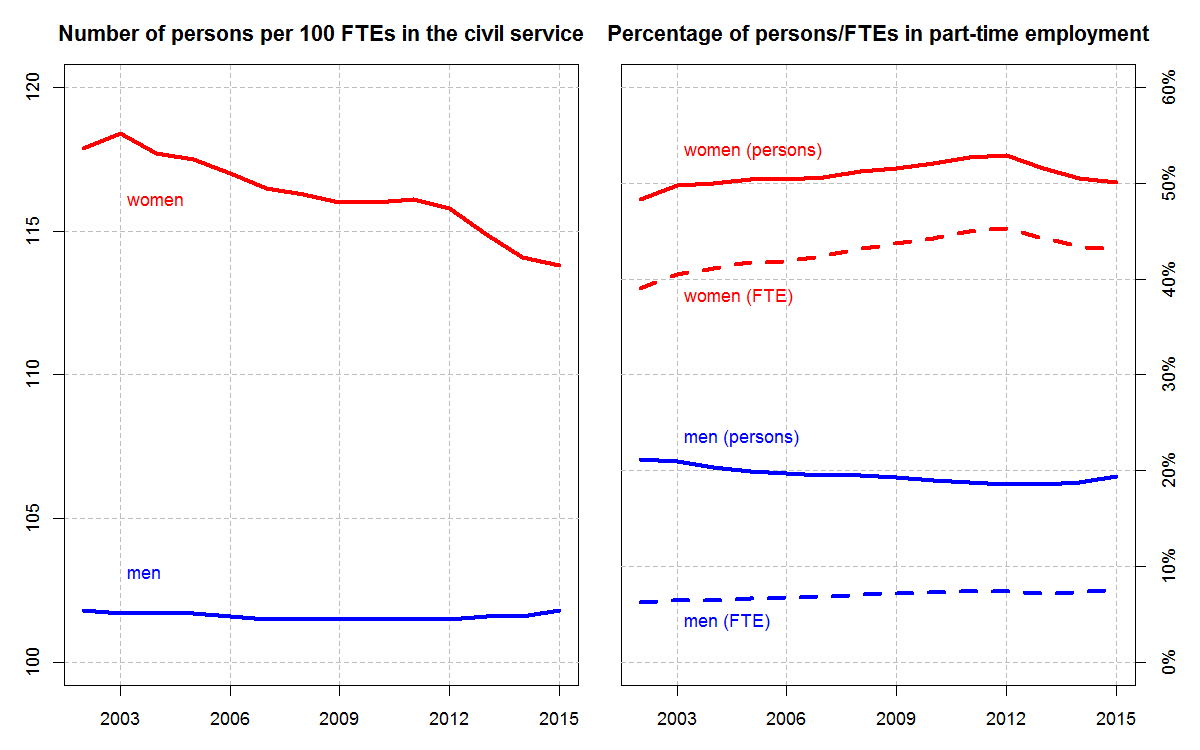
All the data presented so far has been defined in terms of FTE and not actual persons employed in the civil service. Therefore, it is necessary to examine the trends regarding the type of contracts the civil servants have: whether these contracts are full time or part time and whether they are permanent or temporary. The left panel of Figure 16 shows the ratio of persons employed per 100 FTE over time. The ratio has clearly declined for women, but has remained stable for men. In 2003 there were approximately 102 male civil servants per 100 FTE, and 118 female civil servants per 100 FTE. In 2015 the number has remained roughly the same for men, but has dropped to 114 for women. This would seem to imply that fewer women work on part-time contracts nowadays, but this inference is not supported by the data presented in the right panel of Figure 16.
The right panel of Figure 16 plots the percentage of persons (solid lines) and FTE (dashed lines) that are in part-time employment over time, for men (in blue) and women (in red) separately. The share of women in part-time employment (from all women) has actually increase slightly, and even more so when we look not at persons employed but FTE. For men, the changes are tiny (less the two percentage points) and there are no clear trends, both in terms of persons and FTE. We should note that in absolute terms women remain much more like to hold part-time contracts than men. However, on average these part-time contracts for women must be getting bigger (closer to full-time), as suggested by the left panel of Figure 16.
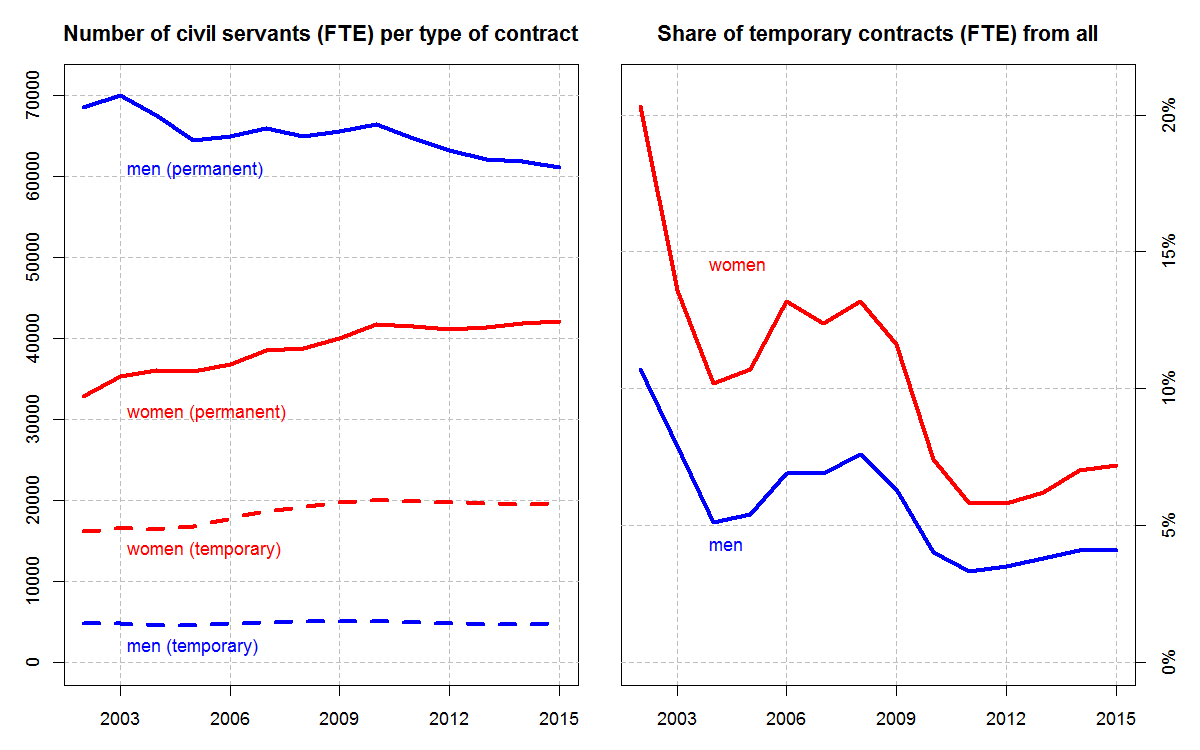
Another important dimension of the type of contract of the people working in the civil service is whether it is temporary or permanent. The left panel of Figure 17 shows how the number of civil servants (FTE) in each category has changed over time (separately for each gender). The number of men on temporary contracts has remained relatively stable, while the number of men on permanent contracts has declined. The number of women on temporary and on permanent contracts has increased, but the increase has been much bigger for the latter. Accordingly, when we look at the relative shares of civil servants on temporary contracts (right panel of Figure 17), we can note that the share of women on temporary contracts from all women (in FTE) in the civil service has declined dramatically from around 20% in 2003 to around 7% in 2015. For men, the share of men on temporary contracts has also declined to around 4%, but from a lower starting point in 2002 (around 11%). Overall, it does not seem that the modest reduction in the total size of the civil service since 2002 has been achieved though increasing the numbers and shares of civil servants on temporary contracts.
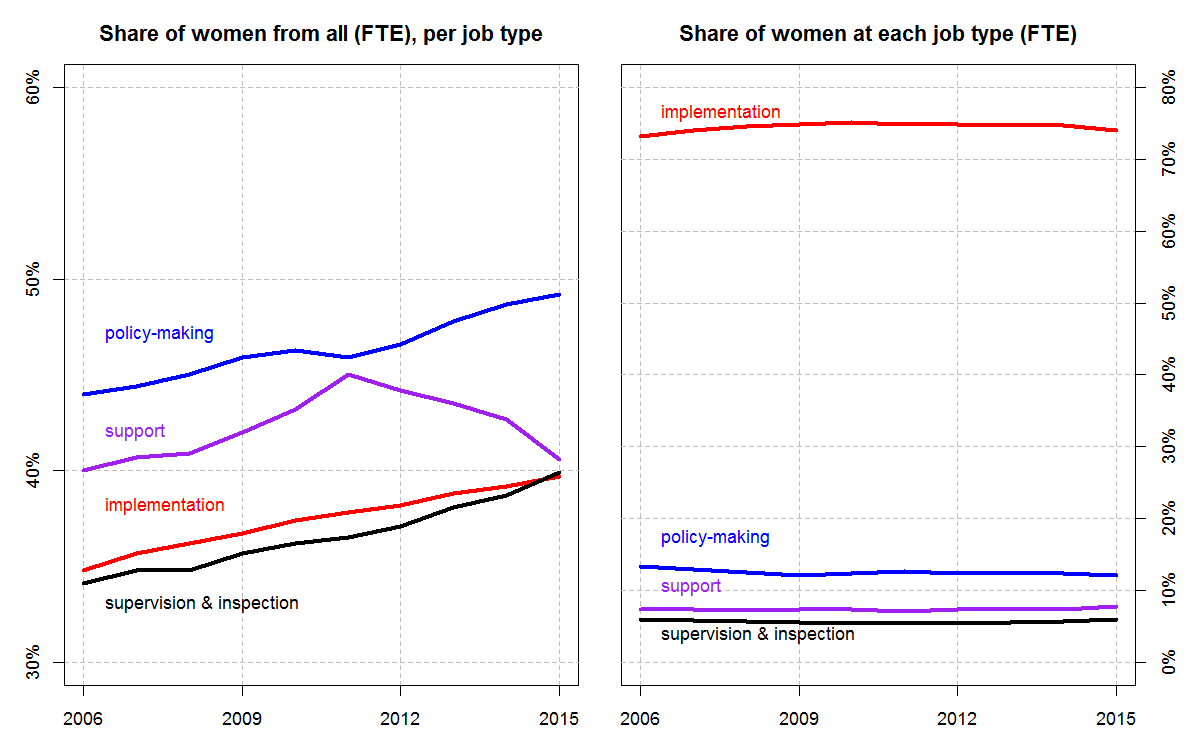
Finally, let's consider the changes in the distribution of functions performed by the civil servants per gender over time. The available data allows for only a rough categorization between policy-making, implementing, supervisory, and supporting functions only, and is available from 2006 onwards. Overall, there has been almost no change in the distribution of the civil service across these categories. But looking at Figure 18 (left panel), which focuses on the share of women at each category, some trends are visible. From all policy-making positions (FTE) in the civil service, around 43% have been held by women in 2006, but almost 50% in 2015. There are similar increases of the relative shares of women for jobs related to implementation and supervision/inspection. In fact, the only job function for which the relative share of women is similar in 2006 and 2015 is support. Nevertheless, when we look at the distribution of women in the civil service across the different function categories, there is surprising stability (right panel of Figure 18). This is consistent with a picture where women account for higher shares of all civil servants at all job functions, but the increase is proportional across these job functions.
Since 2002, the Dutch civil service has experienced significant transformations. The overall size has been reduced marginally (less than 10%), and the civil service remains a relatively minor share of the Dutch (working) population and work force. The changes from year to year have not been all in the same direction, and almost all governments have mixed records when it comes to the growth or decline of the total size of the civil service.
The small marginal reduction has gone hand in hand with a considerable increase in the seniority of the remaining civil servants. The higher ranks have grown both in terms of absolute number of people working at these ranks and in terms of their relative share from the civil service as a whole. The increasing seniority likely outweighs in financial terms the overall reduction.
The gender balance of the civil service has improved, but it is still not perfect. More importantly, there remains a significant imbalance at the higher ranks of the civil service. Still, in 2015 women comprise higher relative shares at all job functions in the civil servants than 10 years ago.
The number and share of temporary contracts, as well as the ratio of persons per FTE have declined, especially for women, but women are still much more likely to work part-time than men in the civil service.
Perhaps the most dramatic transformation between 2002 and 2015 has been the overall aging of the civil service. While the number of young and middle-aged civil servants has declined, the number of civil servants aged 55 and above has increased substantially. These patterns are stronger for men than they are for women.
These patterns are altogether similar across the ministries, despite several important exception discussed in the text above. Most ministries have declined in size, increased their seniority, improved their gender balance, and experienced significant aging of their civil service workforce.
This text and the accompanying figures are based on the following data source: Kennisbank Openbaar Bestuur, managed by the Ministry of Internal Affairs. Most figures use data the dossier Werknemers Overheid en Onderwijs, source (databron) DienstverbandenRijk. The data has been retrieved from this database on 22 November 2016.
The following translations in English of the Dutch names of the ministries have been used:
| Abbreviation | Dutch name | English name |
|---|---|---|
| AZ | Algemene Zaken | General Affairs |
| BZK | Binnenlandse Zaken en Koninkrijksrelaties | Internal Affiars |
| BZ | Buitenlandse Zaken | Foreign Affairs |
| EZ | Economische Zaken (Ministerie van Economische Zaken, Landbouw en Innovatie, 2011) (includes Landbouw, Natuur en Voedselkwaliteit, 2002-2010) | Economic Affairs (includes Agriculture and Innovation) |
| FIN | Financien | Finance |
| HCS | Hoge Colleges van Staat | Other State Organs |
| I&M | Infrastructuur en Milieu (Volkshuisvesting, Ruimtelijke Ordening en Milieubeheer, 2002-2011) (includes Verkeer en Waterstaat, 2002-2010) | Environment (includes Transport and Infrastructure) |
| V&J | Justitie (Veiligheid en Justitie, 2011-2012) | Justice |
| OCW | Onderwijs, Cultuur en Wetenschappen | Education (includes Culture and Science) |
| SZW | Sociale Zaken en Werkgelegenheid | Social Affairs |
| VWS | Volksgezondheid, Welzijn en Sport | Health (includes Sport) |
This presentation has been put together by Dimiter Toshkov, with the help of Eduard Schmidt and Caspar van den Berg.
Last update: 14 March 2017.
If you use the text or the figures, please provide the following reference:
Toshkov, D. (n.d.) 'The Changing Face of the Dutch Civil Service, 2002-2015: A Visual Exploration', Online presentation, available at: http://www.dimiter.eu/csnl.html
