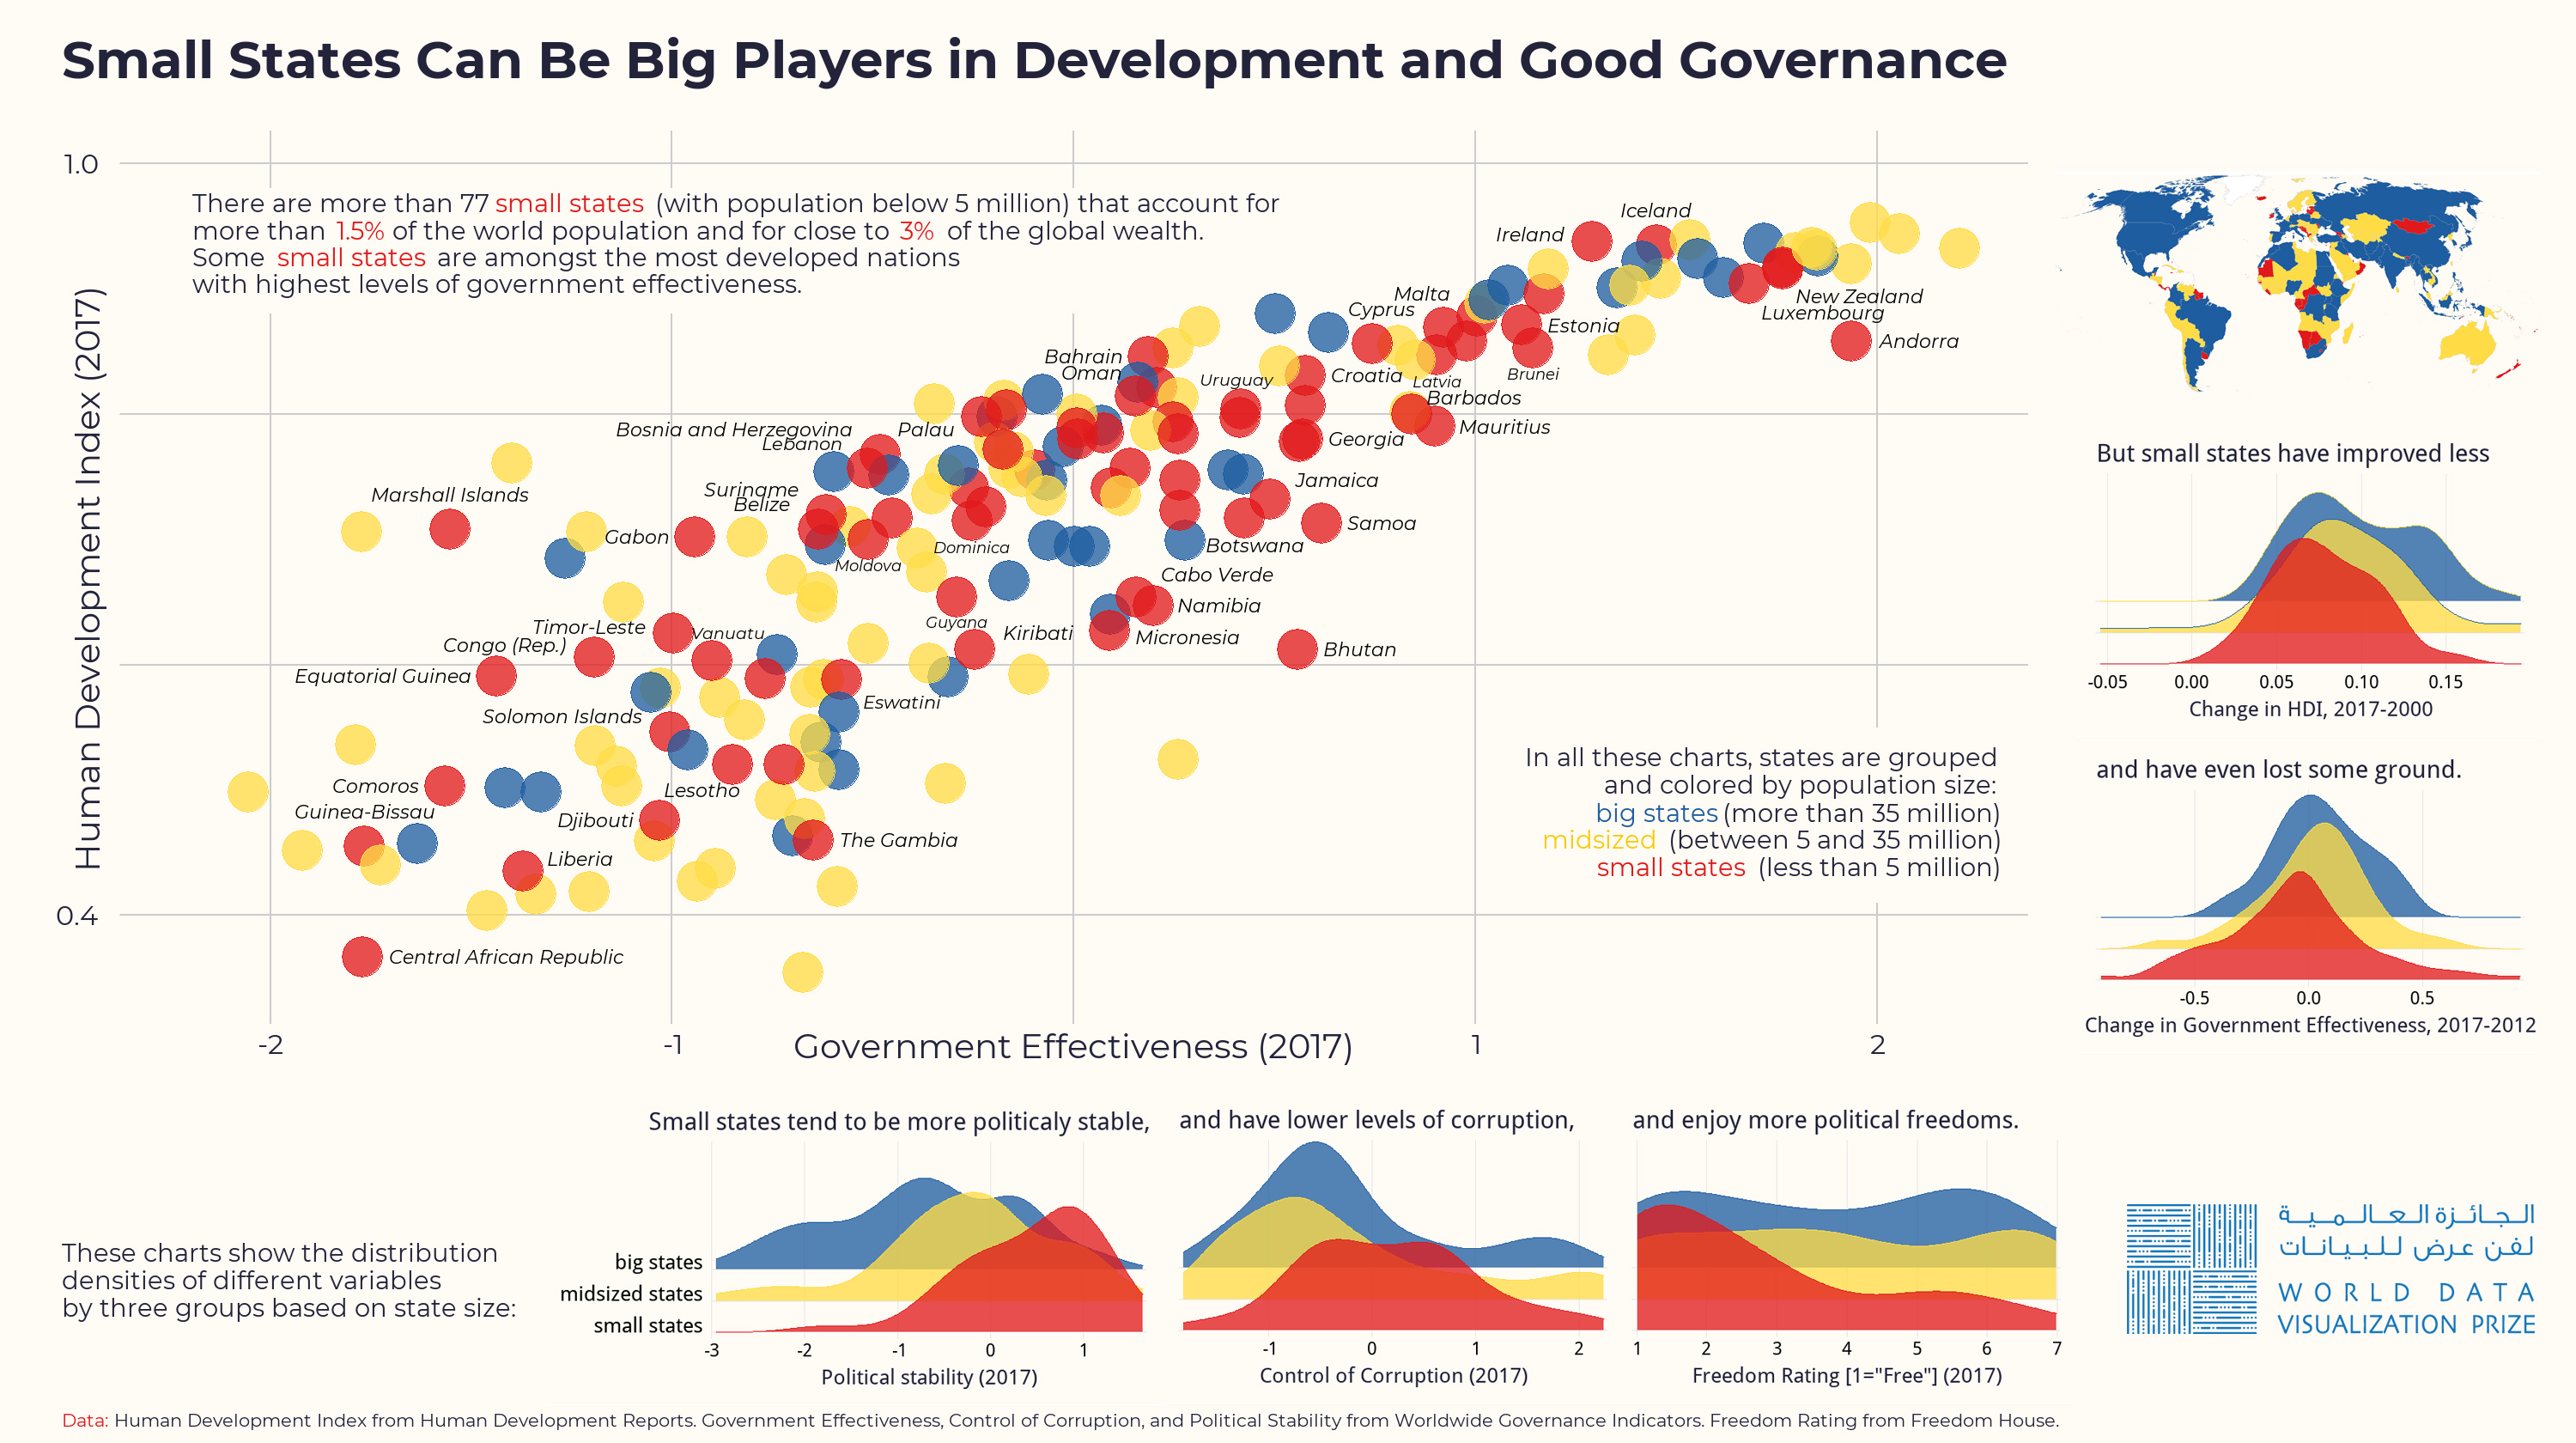
My entry for the World Data Visualization Prize 2019 has won first prize in the 'static image' category! I am super happy, very honoured and feel quite lucky that my charts have been selected among hundreds of submissions. The winning entry is on the theme of 'small states' and development. It features a scatterplot of Human Development Index (HDI) vs. the World Bank's Government Effectiveness index, a map, and a series of density (ridge) plots that show that small states tend to be more politically stable, less corrupt, and more free than middle-sized and big states. But I also show that over the past few years small states have improved less. I did all the charts in R, using the ggridges and rworldmap libraries. The code for the graphs is here.
The competition was organized by the World Government Summit in cooperation with Information is Beautiful.
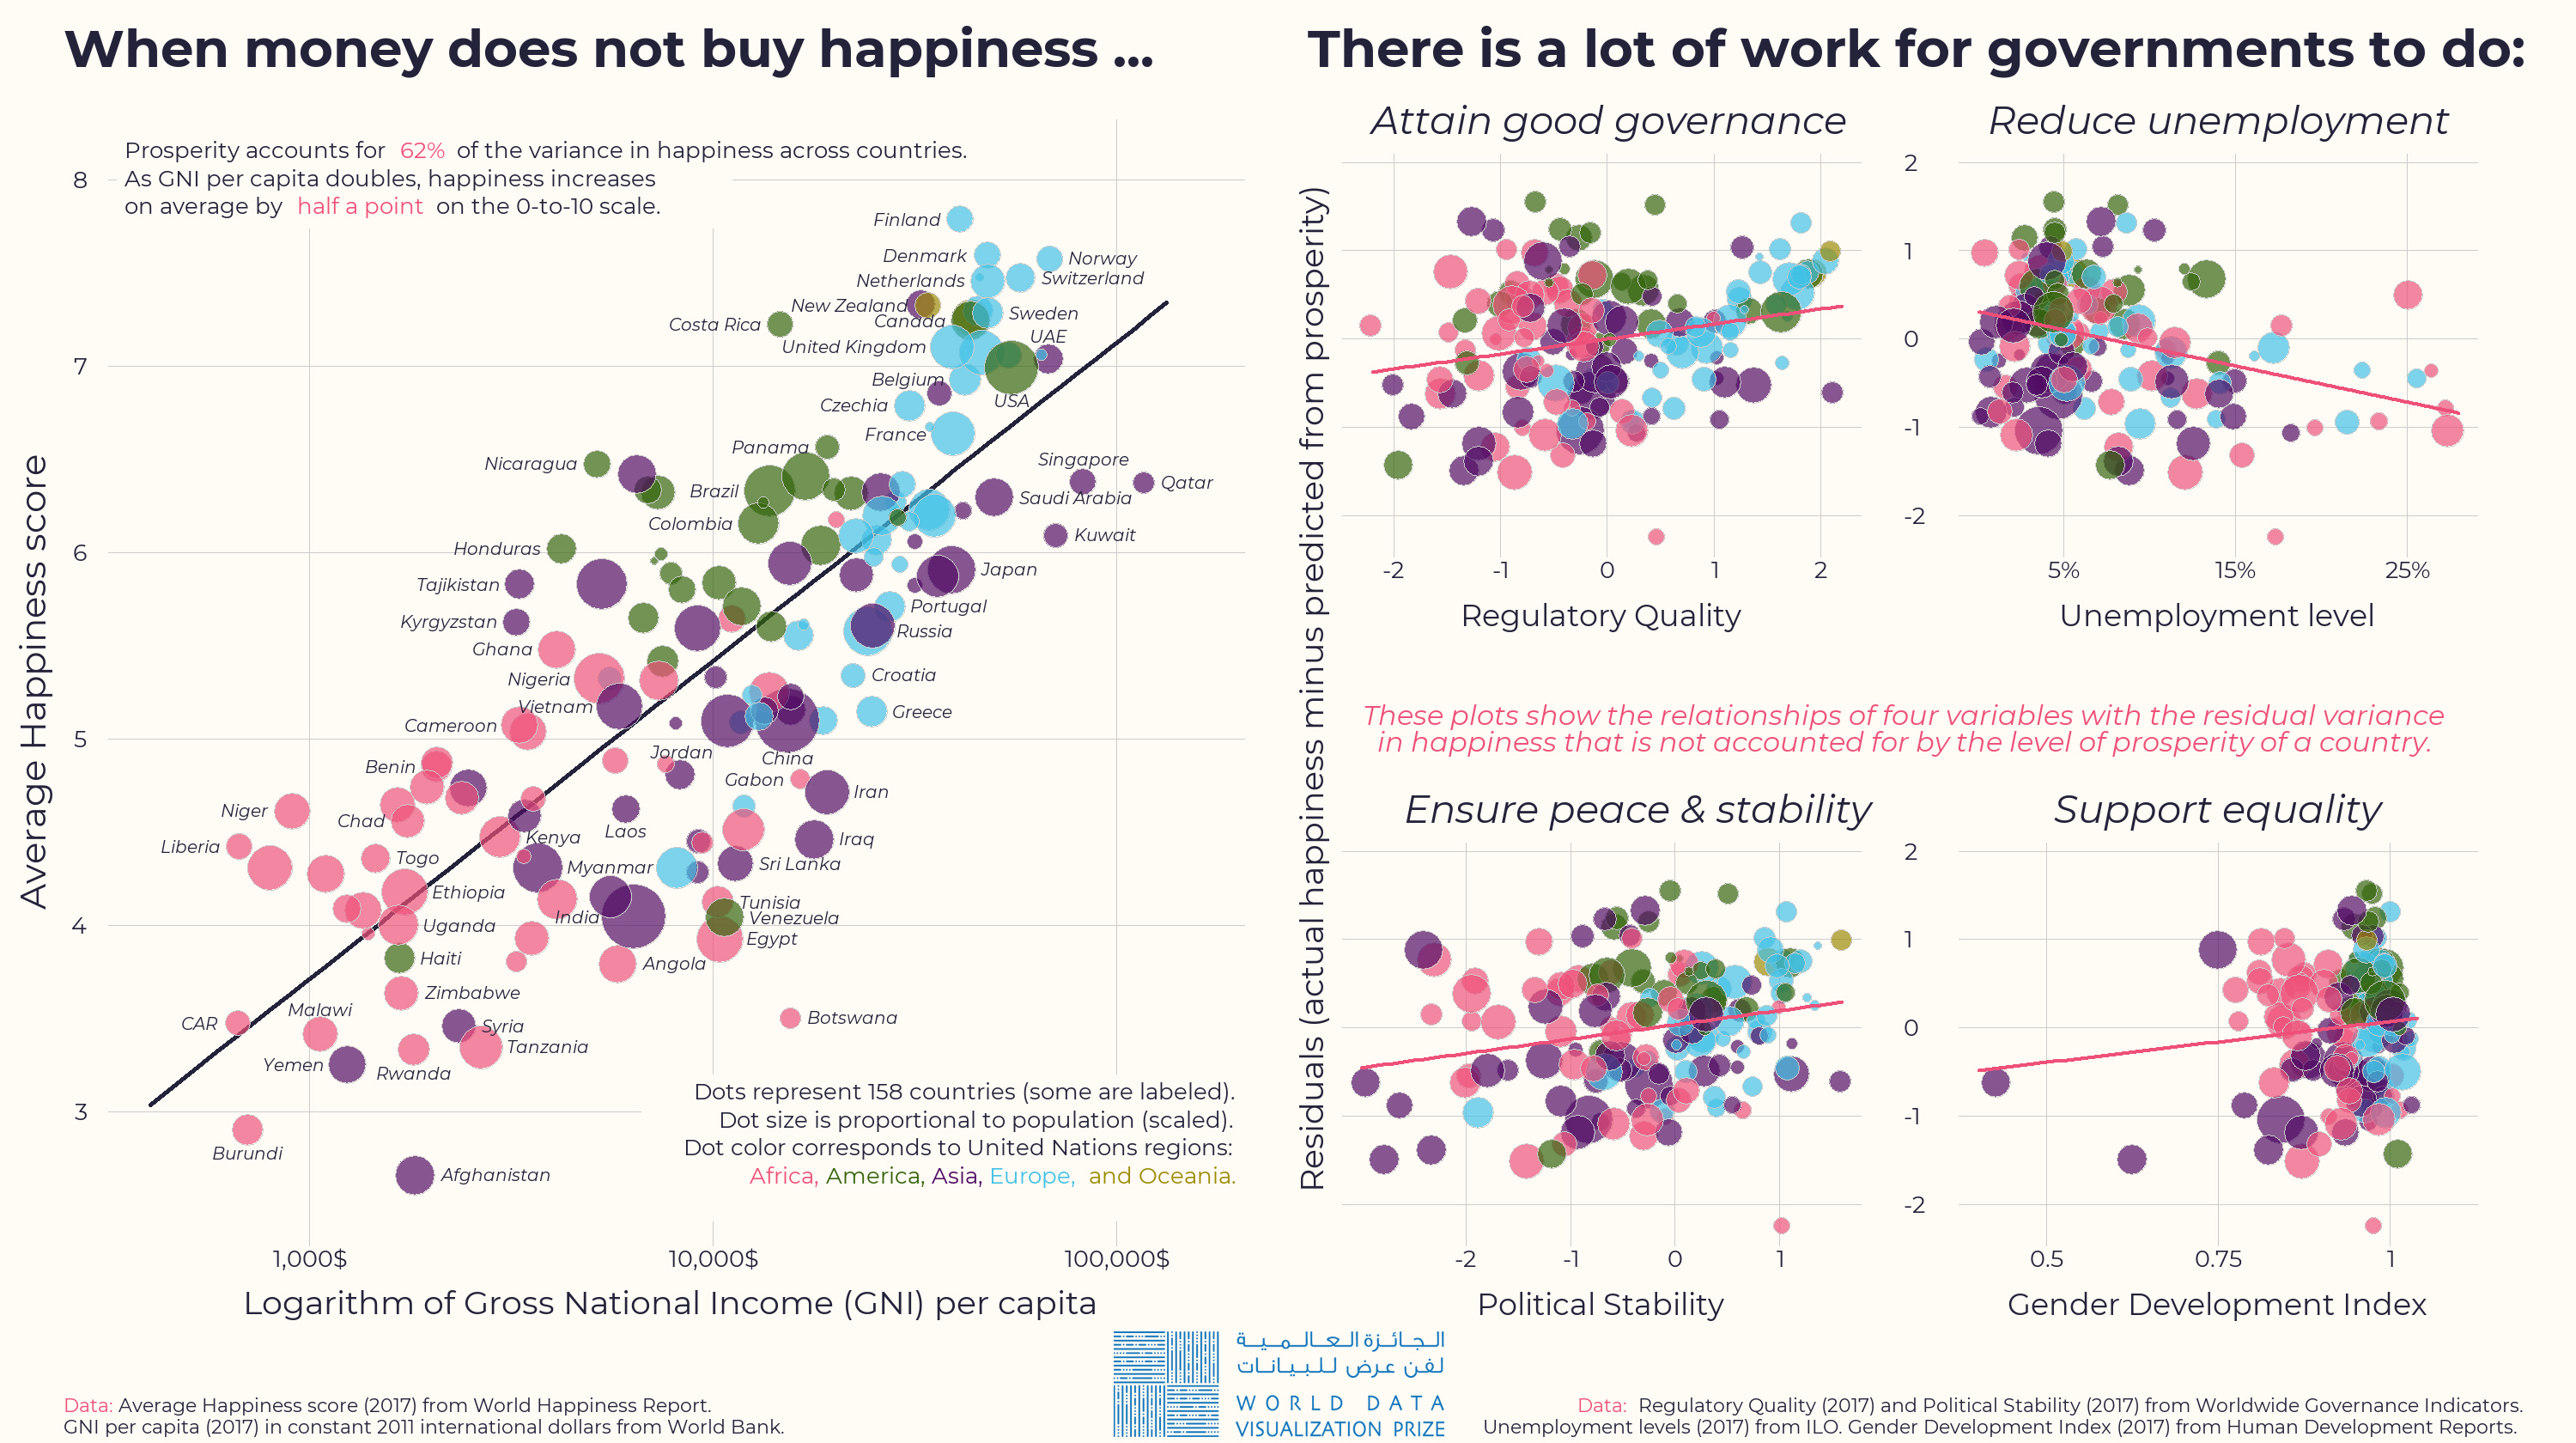
I also submitted an entry on the theme 'What Makes A "Good" Government?'. It didn't make the cut, but I think it's also quite cool. You can see it below.